
Graph Authoring
Graph Editor
Read graph routes, edit through the Flow Inspector or dedicated editors, and verify the intended runtime instance.
- Audience
- All developers
- Time
- 10 minutes
- Requires
- A Flow Graph asset
- Modules
- Flow Core
On this page
Use the Flow Graph Editor to author routes, edit nodes, and inspect a running process.
Open a graph
Open Tools > Flow Core > Flow Graph Editor, then select a Flow Graph. You can also open a graph asset directly from the Project window.
The workspace separates routes, details, and runtime context:
- canvas: authored nodes and connections;
- toolbar: graph and runtime context;
- Flow Inspector: selected or pinned node details;
- node content and dedicated editors: fields, Instructions, and Conditions;
- runtime visualization: recent execution for the selected process.
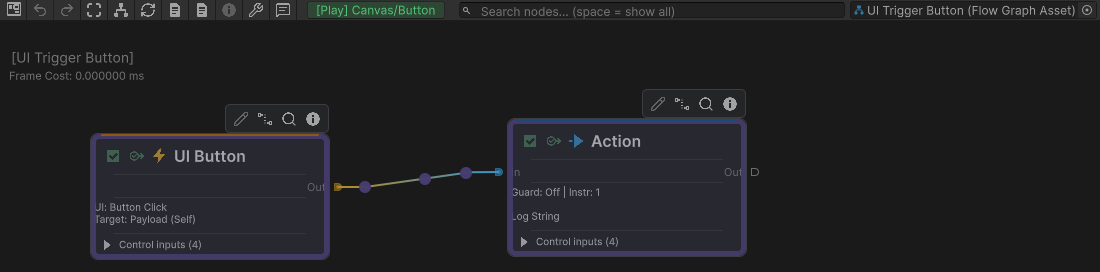
The toolbar identifies UI Trigger Button and [Play] Canvas/Button. The canvas shows UI Button connected to an Action with one Log String Instruction, with purple execution outlines and connection pulses.
Author a readable route
- Right-click empty canvas space to open node search.
- Add the start point before adding downstream behavior.
- Add nodes near the branch that owns them.
- Drag from an output port to a compatible input port.
- Read the route from start point to visible result.
- Add comments when a region’s responsibility is not clear from node titles.
Flow ports describe execution. Typed values are configured inside node or Instruction fields rather than being treated as generic data wires.
Use title commands Rename, Open Node Editor, and Information to change a title, open separate details, or read its reference.
Simple presentation emphasizes topology and Inspector editing; Classic exposes more canvas details. Presentation does not change execution.
Expand Control Inputs to inspect supported auxiliary ports. A compatible connection drag can temporarily reveal hidden ports. Connect by port name and behavior; hiding a port does not disconnect it.
Use detail intentionally
Select a node in the Flow Inspector or choose Open Node Editor. Expand an Instruction to edit typed values. Enable Show summaries to show its data summary alongside fields, including value sources and target resolution.
A collapsed Instruction row retains its name; it does not retain the typed data summary. Verify the Blackboard path in the expanded entry before reducing detail.
Single Focus opens one leaf entry per node and editing surface; Continuous supports comparison. Pin the Inspector to retain a target while selecting another node. See Node Inspector & Entry Editing for expansion, pinning, docking, and dedicated editors.
Display preferences belong to Personal in Edit > Project Settings > Flow Core. See Personal & Project Settings for their scope.
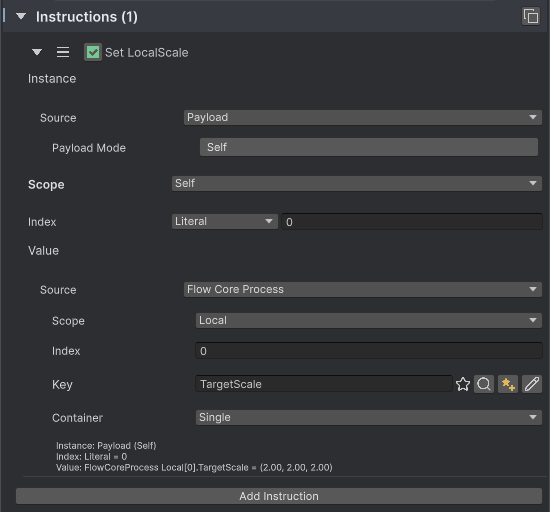
The expanded entry exposes Payload Self for Instance and Local Blackboard zero’s TargetScale for Value; its summary resolves the Vector3 to (2.00, 2.00, 2.00).
Use entry commands in the current view
Instruction and Condition headers reveal commands on hover or focus. More retains commands when shortcuts are hidden. See the entry editing workflow and Field Information & Flow Knowledge.
Edit dependent fields without losing your place
In the reflection UI, change a value’s Source or Target and inspect the fields that become relevant. For example, a Blackboard list route needs key and element-index configuration, while a payload route exposes its applicable payload options. Hiding a field with a Show rule does not itself clear its stored value; value types still apply their own Source and Target constraints.
Ordinary reflected field edits refresh visibility and summaries in place, preserving the active controls, focus, foldouts, and scroll position. Other open views of the same data refresh to reflect the change. Adding, removing, or reordering list items changes the structure and can rebuild controls; Undo/Redo and a custom drawer’s explicit rebuild request can also rebind them.
For a real conditional-field example, select an Enum type on an Enum node, choose the Target value source, and expand its Target Resolver. Add a Steps entry and compare these states:
| Step choice | Fields to inspect |
|---|---|
| Source = Local, Expect = BlackboardList | Index, Key, Expect, and Expect Index |
| Source = Payload, retaining Expect = BlackboardList | Payload Expect appears; Index, Key, and Expect are hidden. Expect Index remains visible because the stored expectation is still a list. |
This changes the authored resolver route. Return to the intended configuration before running the graph. For rules on custom fields, see Authoring Custom Instructions.
Expand the rows you are editing
In 5.3, supported rows build their detailed controls when you expand them and release those controls when you collapse them. Authored values remain intact. Expand again to inspect the current data.
This applies to Instruction and Condition lists; FSM instructions, transitions, and transition conditions; Guard and Wait conditions; Stack instruction sections; If/Else groups; Enum outputs; Gather branches; weighted Combiner branches; and BT child rows.
Use each row’s enable control when you intend to change whether it participates. Collapse only changes the editor presentation. Reordering or removing a branch is a separate authoring action that changes its data and associated ports.
Set Debug Context
Debug Context is the scene GameObject the editor uses to resolve Local and Scene data previews and filter runtime visualization. Choose the object whose FlowCoreProcess actually runs the graph.
If several objects share one graph, switch Debug Context when you switch the object you are investigating. The graph asset remains the same; the explained runtime instance changes.
Verify in Play Mode
Use a small visible result while authoring. In Play Mode, confirm:
- the expected Trigger or Entry starts;
- chain movement follows the intended connection;
- async work remains visibly active while waiting;
- node summaries resolve against the selected process;
- the Game view, Inspector, Console, or Blackboard shows the result.
Common mistakes
| Symptom | Check |
|---|---|
| Node summaries are unresolved | Select the correct Debug Context and verify its Blackboard bindings. |
| A node exists but never runs | Trace a complete connection from a Trigger or Entry. |
| Runtime highlighting is empty | Confirm the selected process is the one that received the event. |
| A graph becomes hard to scan | Separate responsibilities into regions and keep long Instruction lists focused. |