
Debug and Maintain Projects
Debugging Running Graphs
Find where a graph start, route, result, or typed value diverges from the authored intent.
- Audience
- All developers
- Time
- 10 minutes
- Requires
- A reproducible Play Mode result
- Modules
- Flow Core
On this page
Debug one boundary at a time: runtime owner, start point, connection, node result, then value source. This order prevents an incorrect scene binding from being mistaken for a node problem.
Reproduce one result
Reduce the issue to one Trigger or Entry and one observable result. Open the Game view, Console, relevant Inspector, and Flow Graph Editor. Enter Play Mode with the intended scene object selected.
1. Confirm the runtime owner
- Select the GameObject that should run the behavior.
- Confirm
FlowCoreProcessis enabled. - Confirm it references the graph you opened.
- Confirm required Local Blackboards are bound at the expected indices.
2. Confirm the start point
For a Trigger, verify event source and settings. For an Entry, verify the caller uses the exact identity or title. Add a temporary visible Action immediately after the start if necessary.
3. Set Debug Context
Choose the exact GameObject whose process receives the event. Runtime visualization is filtered by process context. Another object using the same graph may show its own route instead of the chain you are investigating.
Graph selection, a pinned Flow Inspector target, and Debug Context are separate choices. Check the Inspector title when reading a node, then check Debug Context when interpreting its runtime values. Unlock a pinned pane if it should follow your current graph selection.
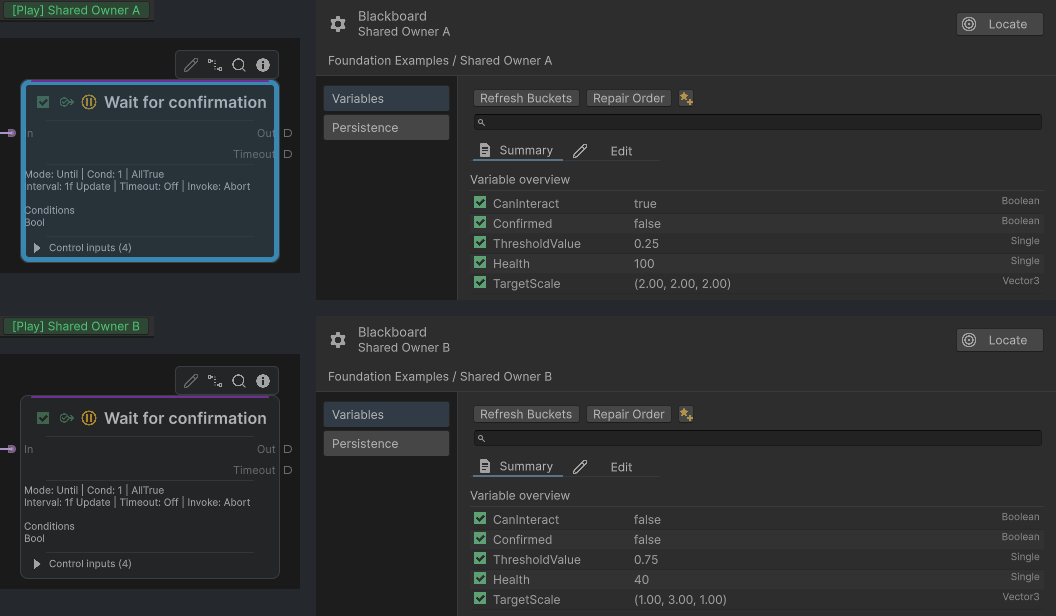
Native excerpts from each Debug Context: Owner A remains waiting with CanInteract true. Owner B completed the Rejected route with CanInteract false; its transient highlight has faded.
4. Follow the execution route
Trace the active connection from the start point. At the first node that differs from expectation, inspect:
- Guard Conditions and Reject Result;
- On Busy Behavior (Invoke Mode) if the node can be reached while busy;
- Pass Enabled for supported control-input nodes;
- output selection and connected branch;
- any waiting, retrying, or module-specific lifecycle state.
5. Validate the value path
Check the complete typed source: literal or context mode, Blackboard scope, index, key, type, payload availability, and target resolution. Editor summaries help locate a mismatch, but Play Mode is the source of truth for timing and current state.
Expand the relevant Instruction or Condition in the Flow Inspector or Node Editor. Single Focus keeps the required ancestor path visible; choose Continuous when comparing two entries. Use More > Information to explain a field, but read the actual configured value in the editor and the live value from the intended runtime owner. Opening a reference or expanding a row does not bypass the Play Mode editing lock.
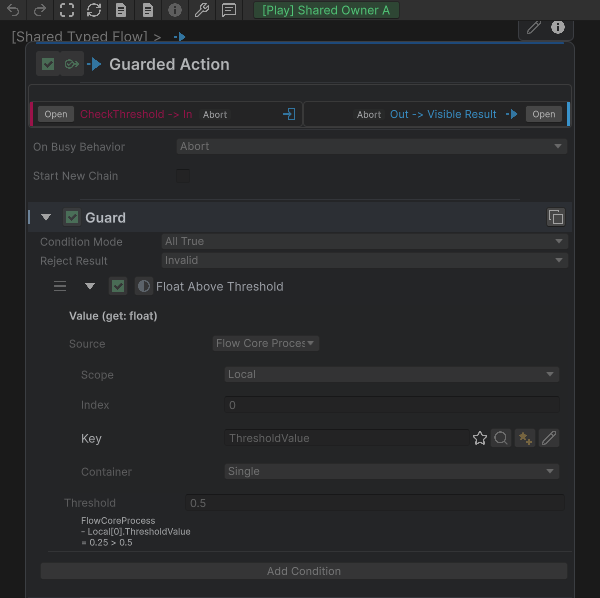
The Guard excerpt shows Local[0].ThresholdValue at 0.25 failing the 0.5 threshold. Check Guard and Reject Result, On Busy Behavior, and the typed value path here, then confirm the matching Guard warning in Console.
Read visual debugging
Recent node color, outlines, and moving edge indicators show chain direction and results. Pulsing or held visualization commonly indicates async work that is still active. Module trees may show evaluation differently from normal Flow, so confirm root activation before examining children.
Choose the diagnostic scope
Open Edit > Project Settings > Flow Core. In Personal > Diagnostics, configure Enable Process Profiler and History Frames for your editor session. Personal display choices are under Appearance; teammates can use different levels of detail while inspecting the same graph.
To investigate a duplicate persistent object, enable Log Persistent GUID Collisions under Personal > Diagnostics > Editor Registry Logging. This personal option is off by default and affects that warning only in Editor Play Mode; see Persistent GUID collision logging for the workflow and cleanup behavior.
Invoking-chain debug and Blackboard comparison warnings belong to Project Shared > Diagnostics because they affect runtime behavior. Coordinate those changes through the shared settings asset. See Personal & Project Settings before changing diagnostics for a team investigation.
Common mistakes
- Editing a shared graph while inspecting the wrong process instance.
- Changing topology before confirming the Trigger or Entry starts.
- Checking only key spelling and not Blackboard scope, index, and type.
- Treating an expected Invalid result as if execution disappeared.
- Ignoring repeated events while a node remains busy or waiting.